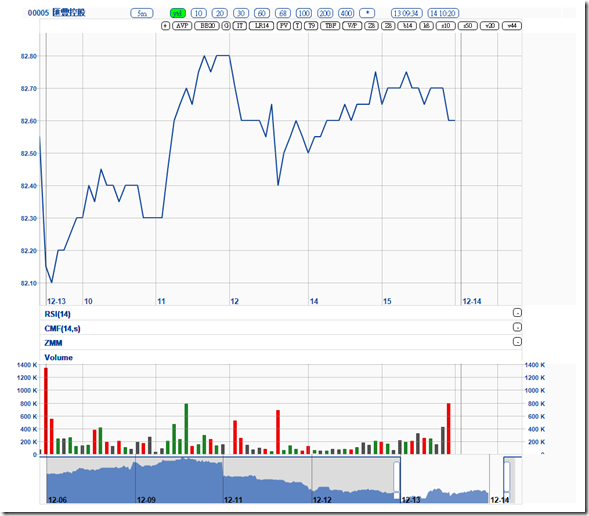
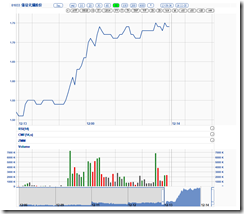
Look at the trading volume of # 0005 yesterday, you can see a U shape:
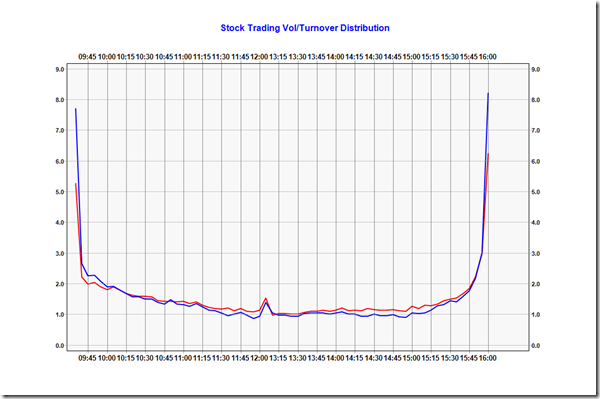
To average out all the stocks, a volume and turnover distributions graph is:
The blue line is the turnover distribution, the red line is trading volume distribution.
Both of them showing a U shape, with a small spark after lunch. Busiest moment is first five and last ten minutes. The most quiet moment is after 13:05 and before 14:00, and momentum catching up after 3:00.
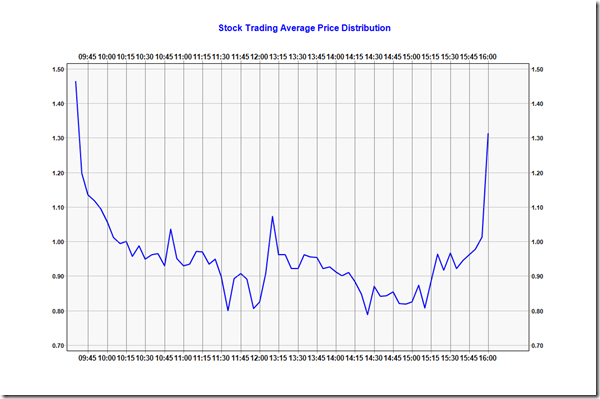
Divide these two data:
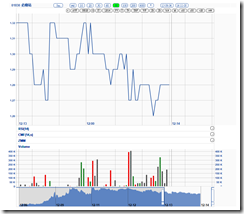
Interesting information is, typical stocks traded with a smaller price (usually small cap), are relatively more active between 11:30 to 12:00, and 14:00 to 15:00. At those periods, big accounts take rests and market relatively more focus on smaller caps, for examples:
